In [446]:
import dolfin as df
import matplotlib.pyplot as plt

import mshr
Conduction thermique stationnaire 2D avec Fenics

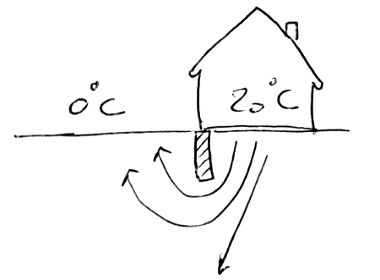
La température est fixée (condition de Dirichlet) sur la zone chauffé, de longeur house_half_size. Une Isolation vertical (fondation) de hauteur isolation_depth et de largeur isolation_thickness. Une condition de symmétrie est fixée pour la bordure droite. La température sur la surface extérieure (à gauche de l'isolation), ainsi que sur les cotés dans le sol, gauche et bas, est fixée à 0°C (température moyenne extérieure et température moyenne relative du sol).
In [466]:
# Geometry
isolation_depth = .6  # m
isolation_thickness = .06  # m
house_half_size = 4  # m
domain_size = 14  # m

domain = mshr.Rectangle(df.Point(-domain_size, -1.5*domain_size),
                        df.Point(house_half_size, 0.))
isolation = mshr.Rectangle(df.Point(0.0, -isolation_depth),
                           df.Point(isolation_thickness, .0))

domain.set_subdomain(1, isolation)
In [467]:
# Mesh
mesh = mshr.generate_mesh(domain, 120)

df.plot(mesh);
plt.xlim([-2, 2]); plt.ylim([-2, 0]);  # zoom
Conditions aux limites
In [ ]:
class SurfaceExt(df.SubDomain):
    def inside(self, x, on_boundary):
        surface = on_boundary and\
                  df.near(x[1], 0, df.DOLFIN_EPS) and\
                  x[0]<0
        left_side = df.near(x[0], -domain_size, df.DOLFIN_EPS)
        bottom_side = df.near(x[1], -1.5*domain_size, df.DOLFIN_EPS)
        return surface or left_side or bottom_side

class SurfaceInt(df.SubDomain):
    def inside(self, x, on_boundary):
        return on_boundary and\
               df.near(x[1], 0, df.DOLFIN_EPS) and\
               x[0] > isolation_thickness-df.DOLFIN_EPS

# Marquage des frontières:
surface_ext = SurfaceExt()
surface_int = SurfaceInt()

boundary_markers = df.FacetFunction("size_t", mesh)

boundary_markers.set_all(0)
surface_ext.mark(boundary_markers, 1)
surface_int.mark(boundary_markers, 2)

# boundary_markers.array()
In [471]:
# Marquage des cellules, à partir de la géométrie:
cell_markers = df.CellFunction("size_t", mesh)
markers = df.MeshFunction('size_t', mesh, 2, mesh.domains())

df.plot( markers )
plt.xlim([-2, 2]); plt.ylim([-2, 0]);  # zoom
In [472]:
# Définition des élements infinitésimaux pour les intégrations
dx = df.Measure('dx', domain=mesh, subdomain_data=markers)
ds = df.Measure('ds', domain=mesh, subdomain_data=boundary_markers)
In [473]:
V = df.FunctionSpace(mesh, "Lagrange", 1)
In [474]:
# Define boundary condition
u_ext = df.Constant(0.0)
bc_ext = df.DirichletBC(V, u_ext, surface_ext)

u_int = df.Constant(20.0)
bc_int = df.DirichletBC(V, u_int, surface_int)

bcs = [bc_ext, bc_int]
In [476]:
# Define input data
k_soil = df.Constant(1.28)  # Soil, W/m/K
k_isolant = df.Constant(0.04) # Isolation

f = df.Constant(.0)  # Source
In [477]:
u = df.TrialFunction(V)
v = df.TestFunction(V)

# Define variational form
a = df.inner(k_soil*df.grad(u), df.grad(v))*dx(0)\
    + df.inner(k_isolant*df.grad(u), df.grad(v))*dx(1)

L = f*v*dx(0) + f*v*dx(1)
In [478]:
# Solve problem
u = df.Function(V)
df.solve(a == L, u, bcs)
In [481]:
# Graph
plt.figure(figsize=(12, 8))
ax = df.plot(u)
plt.xlabel('x [m]');
plt.ylabel('depth [m]');
#plt.xlim([-2, 2]); plt.ylim([-2, 0]);
plt.colorbar(ax); plt.title('temperature stationnaire');
In [483]:
# Zoom
plt.figure(figsize=(12, 8))
ax = df.plot(u)
plt.xlabel('x [m]');
plt.ylabel('depth [m]');
plt.xlim([-2, 2]); plt.ylim([-2, 0]);
plt.colorbar(ax); plt.title('temperature stationnaire');
Post process
In [484]:
# Length of the interior boundary:
L_int = df.assemble( df.Constant(1.)*ds(2) )
print(L_int)
In [492]:
# Flux chaleur vers le sol (linéïque):
F = df.assemble( k_soil * df.Dx(u, 1)*ds(2) )
print(F, ' W/m')

# Flux moyen surfacique:
print(F/L_int, ' W/m2')
In [493]:
# Flux sortant de `domain`
n = df.FacetNormal(mesh)
flux_1 = df.assemble( k_soil*df.dot(df.grad(u), n)*ds(1))
flux_1
Out[493]:
Ref et doc pour Fenics
https://fenicsproject.org/pub/tutorial/sphinx1/._ftut1005.html
Livre : https://launchpadlibrarian.net/83776282/fenics-book-2011-10-27-final.pdf
Solveur plus recent : https://ngsolve.org/ ?
In [ ]:

